
Financial Leverage and Economic-Financial Position (EFP)
5.1.- Logical ratios on the balance sheet
Once we understand a company’s Financial Statements and know how to use a tool like ratios, we will apply it to these Financial Statements and we will get some indicators that compared over time and with other companies will determine the FINANCIAL ECONOMIC POSITION of the company and its evolution in the past.
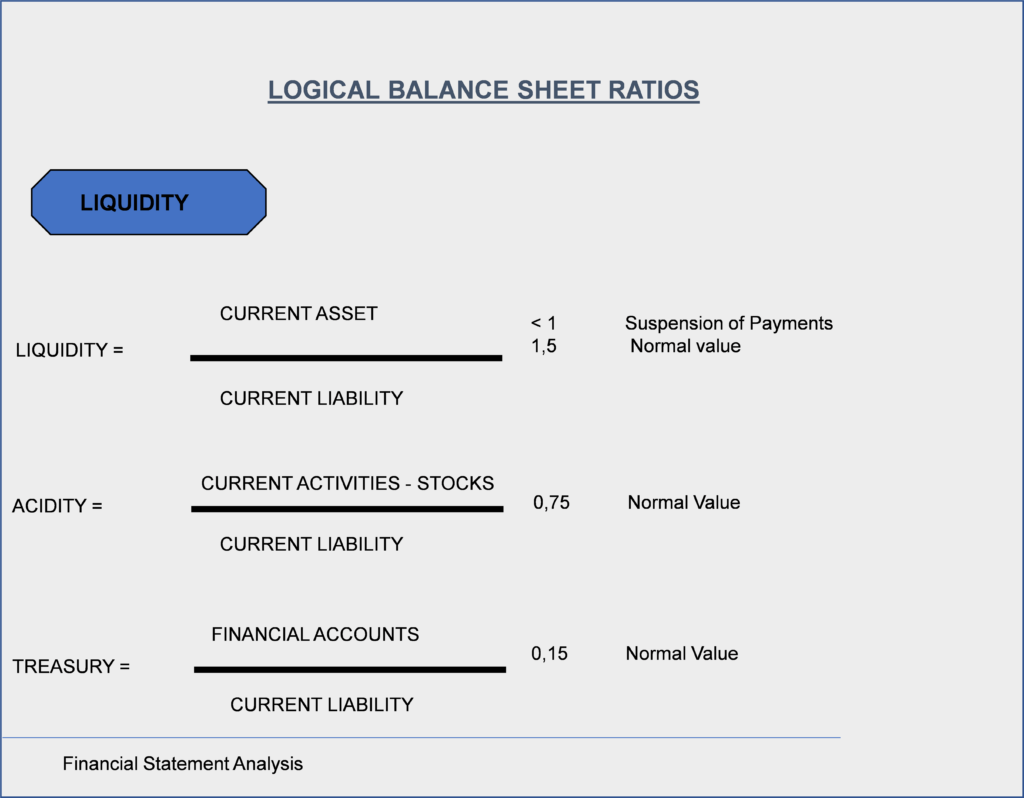
Liquidity
We can define LIQUIDITY as the company’s ability to meet its short-term payment commitments.
When we made the drawing by patrimonial masses of the company already we verified that we could diagnose its situation of liquidity by the difference between the CURRENT ASSETS and the CURRENT LIABILITIES, now by means of the ratios of LIQUIDITY we are going to quantify it more exactly.
The ratio of LIQUIDITY measures the relationship between CURRENT ACTIVE and CURRENT LIABILITIES, as is obvious if the result is less than 1 tells us that:
CURRENT LIABILITIES > CURRENT ASSETS
and therefore, we are in a situation of TECHNICAL PAYMENT SUPPORT
Some authors give the value of 1.5 as the normal value for this ratio, we will consider the value of the ratio for the mean of the sector to which the company belongs as a normal value.
The ACIDITY ratio gives us a little more insight into the company’s liquidity situation by deducting the assets from the STOCK, which as we have already seen is the least liquid of the CURRENT ASSETS and even has a high fixed asset component since we always have to have stock..
Some authors give as the normal value of this ratio 0.75, as in the previous key figure we will work with the sector data.
The TREASURY ratio is even more precise on the immediate liquidity, taking into account only the financial accounts, i.e. the most immediately available, and considering that at least the company must have a percentage of all the short-term receivables in cash, i.e. be able to meet at least the most immediate payments.
Some authors put this ratio at 0.15 as ideal
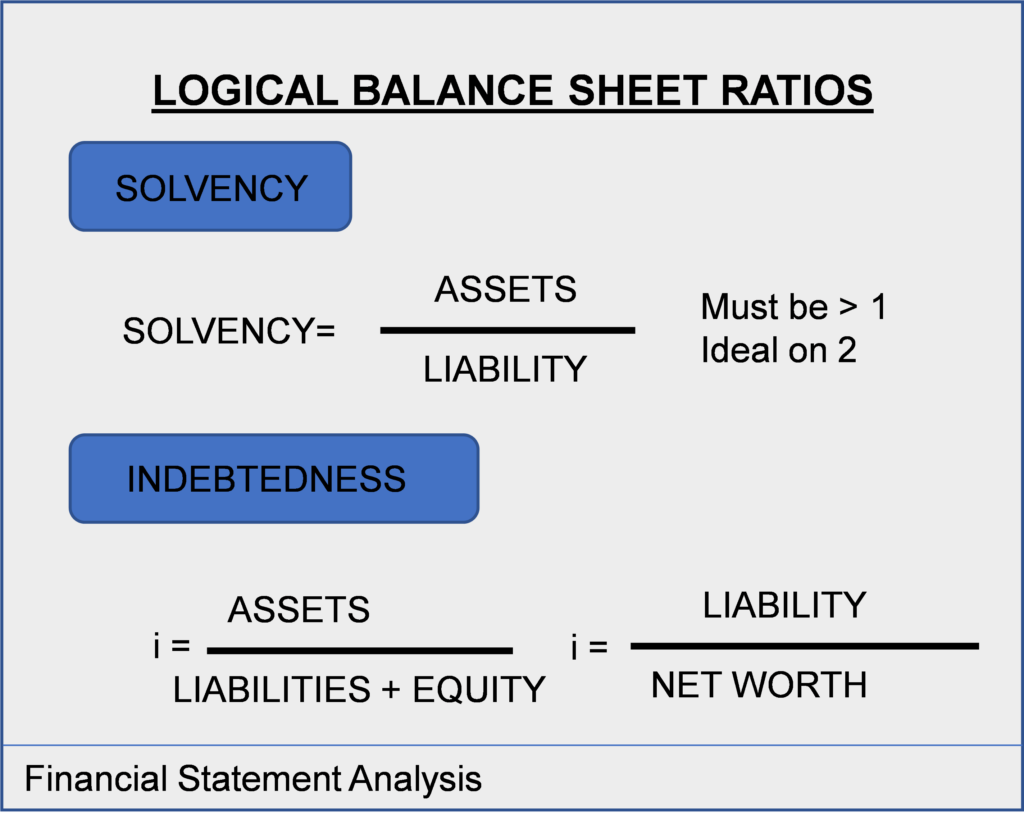
Solvency
The SOLVENCY ratio will measure the company’s ability to meet all its payment commitments, as it compares the company’s ASSETS to all its LIABILITIES.
Logically this ratio should be > 1, that is the ASSETS should be greater than the LIABILITIES, since if this is not the case not even selling the whole company can cope with the debts and we would be in the situation of:
TECHNICAL BANKRUPTCY
The key figure formula is:
ASSETS
_________
LIABILITY
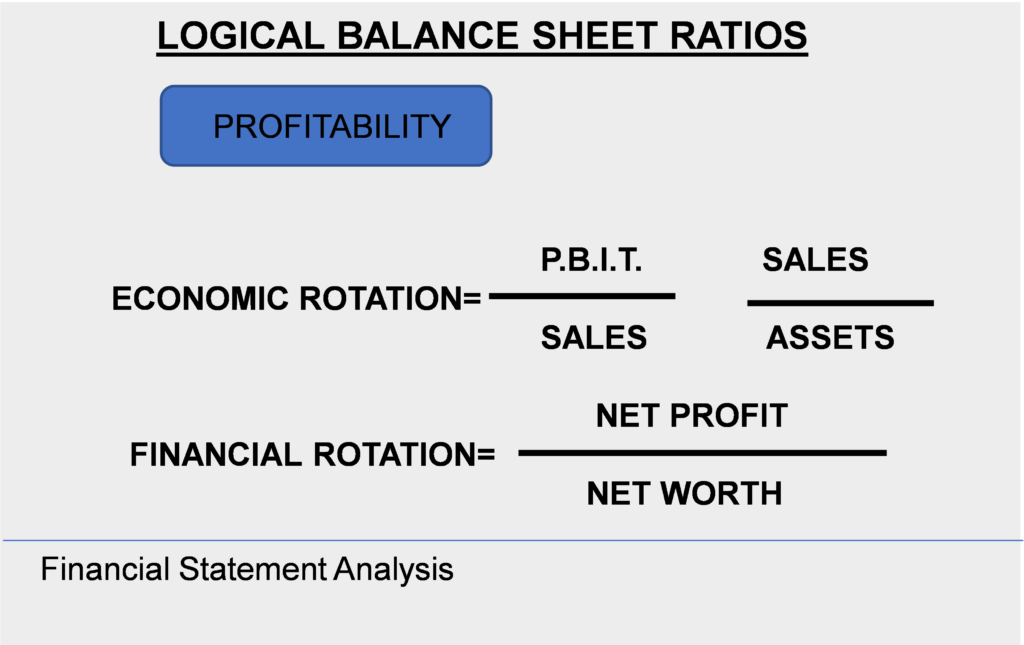
Profitability
Profit-making is a recognized condition as necessary for the survival, growth, and development of a company, but that benefit takes on greater significance when relativized when compared to the resources at stake.
If we give as an example two companies A and B that both get an PBIT of 1,000,000 euros, we could say that the two get the same profit, but if the A has an Asset of 500,000 euros and the B its Asset is 1,000,000 euros, we can no longer say that they earn the same, since they do not put the same resources at stake.
When we talk about profitability, we need to differentiate between:
- ECONOMIC PROFITABILITY
- FINANCIAL PROFITABILITY
Economic profitability refers to that obtained by the company with the resources that the company itself puts into play, the profit that the company obtains itself is the.
P.B.I.T. = Profit Before Interest and Taxes.
Interest depends on the liability structure you have and the taxes of the state’s tax policy.
The resources it puts into play is all your Asset, therefore, the Economic Profitability is obtained by:
P.B.I.T.
ASSETS
The Financial Profitability refers to the one obtained by the shareholders with what they put at stake, the benefit obtained by the shareholders is the NET PROFIT, which goes to their pockets via dividends or will remain in the company as RESERVES, that is, OWN FUNDS, which belong to the shareholders, and we relativize that benefit with what the shareholders put at stake which is precisely the NET WORTH.
Therefore, we obtain the FINANCIAL PROFITABILITY
NET PROFIT
NET WORTH
An important concept that we can highlight arises by breaking down economic profitability into two factors without becoming more than multiplying and dividing its formula by SALES:
P.B.I.T SALES
SALES TOTAL ACTIVE
The first factor corresponds to the SALES MARGIN
The second factor corresponds to ROTATION (how many times I sell my Asset), if I say, economic profitability can be explained as a result of two factors:
MARGIN/SALES x ROTATION
It seems clear that with Low Margins and Rotations it is difficult to survive and that they are also determined by the Market and by the sector in which we work.
But these concepts are important mainly because they introduce us to strategic decisions of the company, that is, if we want to increase our profitability we must in theory increase the two factors, but in practice it is not possible to play to increase margins and rotation at the same time, unless we have the wonderful product…
ACTIVITY
We can illustrate this with the example of the creation of a restaurant, we can decide for a restaurant with low margins but high rotation, or for an a la carte restaurant, high margins with low rotation. But we can’t play both games, luxury restaurant but eating fast, that have to occupy the table other….
The coach must help the entrepreneur / businessman to be able to decide what type of business is his at the moment, margin or rotation
ACTIVITY
The client must continue with his economic-financial plan according to the document and obtain the logical ratios developed
5.2 Financial Leverage
The example should be explained without explaining at the outset the reasons that make each of the above situations different
Only once the case has been developed should the “cost of money” key be entered
We have the following company in a schematic way:
ASSETS NET WORTH and LIABILITY
Fixed assets 100 Net Worth 50
Debt 50
TOTAL100 TOTAL 100
We also assume that the enforceable has a cost of 10% for this company
With this balance we assume three different situations, obtaining in each of them a different profit:
1st SITUATION
You get a PBIT= 20
The EP = PBIT/ASSET = 20/100-20% = 20%
The FP = NET PROFIT / NET WORTH = (BAIT – Interests) / NET PROFIT = (20-0,1 – 50)/50 = 30%
In this case EP < FP
2nd SITUATION
You get a PBIT = 6
The EP = PBIT / ASSETS = -6/100 = 6%
The FP = NET PROFIT / NET WORTH = (PBIT – Interests) / NET WORTH = 6 – 0,1· 50) / 50 = 2%
In this case EP > FP
As we see the relationship between the two returns has changed depending on the profit obtained and this is because we have introduced a new factor which is:
THE PRICE OF MONEY
If we study, it with the formula that relates both returns:
In short, if the cost of the demand is low, the company with money that is not theirs invests it in their business and if their EP > cost money can pay this cost and still have a differential that is, they make money with money that is not theirs, therefore, the profitability for the shareholders is clear.
If the EP < cost money, it turns out that with the profitability we get we don’t even have to pay for what it costs us the money we have used to invest.
It seems obvious that in situations of positive financial leverage it is best to borrow to the fullest, but the profitability always comes from the hand of risk and at a higher return greater risk and indebtedness is synonymous with risk, because if the situation changes we can find a negative leverage in a situation of great indebtedness…